Adding DM-Baryon Relative Velocities
This notebook shows how to include the effect of the DM-baryon relative velocities, and the EOS2021 parameters.
Based on Muñoz+21 (https://arxiv.org/abs/2110.13919). See https://drive.google.com/drive/folders/1-50AO-i3arCnfHc22YWXJacs4u-xsPL6?usp=sharing for the large (1.5Gpc) AllGalaxies simulation with the same parameters. Note that this notebook has been updated to use 21cmFASTv4, while EOS2021 was run with 21cmFASTv3. The results will be slightly different due to various small fixes and improvements in v4, but the basic physics is still the same.
It is recommended to do the other tutorials first.
[1]:
import matplotlib
import numpy as np

%matplotlib inline
import matplotlib.pyplot as plt
from matplotlib import colormaps
import py21cmfast as p21c
from py21cmfast import plotting
from tempfile import mkdtemp

random_seed = 1605

EoR_colour = matplotlib.colors.LinearSegmentedColormap.from_list(
    "mycmap",
    [
        (0, "white"),
        (0.33, "yellow"),
        (0.5, "orange"),
        (0.68, "red"),
        (0.83333, "black"),
        (0.9, "blue"),
        (1, "cyan"),
    ],
)
colormaps.register(cmap=EoR_colour)
Fiducial and lightcones
Let’s fix the initial condition for this tutorial.
[2]:
output_dir = mkdtemp()

inputs = p21c.InputParameters.from_template(
    'Munoz21', random_seed=911,
    node_redshifts=p21c.get_logspaced_redshifts(
        min_redshift=5, max_redshift=35.0, z_step_factor=1.06
    )
).evolve_input_structs(
    HII_DIM=64,
    DIM=172,
    BOX_LEN=200,

)

initial_conditions = p21c.compute_initial_conditions(
    inputs=inputs,
    cache=p21c.OutputCache(output_dir),
)
/home/jed/miniconda3/envs/21cmfast/lib/python3.13/site-packages/attr/_make.py:2893: UserWarning: Resolution is likely too low for accurate evolved density fields
 It Is recommendedthat you either increase the resolution (DIM/BOX_LEN) orset the EVOLVE_DENSITY_LINEARLY flag to 1
  v(inst, attr, value)
[3]:
len(inputs.node_redshifts)
[3]:
32
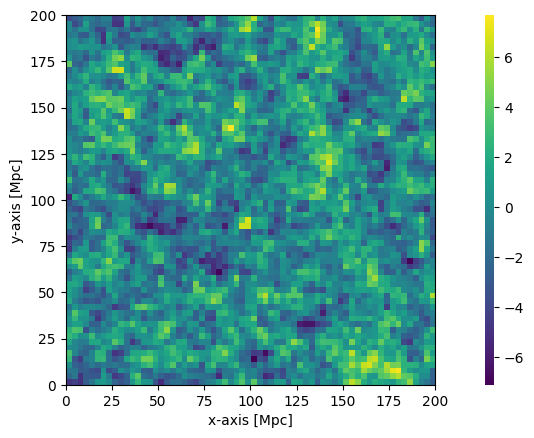
[4]:
plotting.coeval_sliceplot(initial_conditions, "lowres_vcb")
plotting.coeval_sliceplot(initial_conditions, "lowres_density");
Let’s run a ‘fiducial’ model and see its lightcones
Note that the reference model has F_STAR7_MINI ~ F_STAR10and F_ESC7_MINI ~ 1%, as low, but conservative fiducial. Also we take L_X_MINI=L_X out of simplicity (and ignorance).
[5]:
# the lightcones we want to plot later together with their color maps and min/max
lightcone_quantities = (
    "brightness_temp",
    "spin_temperature",
    "neutral_fraction",
    "cumulative_recombinations",
    "z_reion",
    "ionisation_rate_G12",
    "J_21_LW",
    "density",
)
cmaps = [
    EoR_colour,
    "Reds",
    "magma",
    "magma",
    "magma",
    "cubehelix",
    "cubehelix",
    "viridis",
]
vmins = [-150, 1e1, 0, 0, 5, 0, 0, -1]
vmaxs = [30, 1e3, 1, 2, 9, 1, 10, 1]


inputs_no_vcb = inputs.evolve_input_structs(A_VCB=0)

# the flag FIX_VCB_AVG side-steps the relative-velocity ICs, and instead fixes all velocities to some average value.
# It gets the background right but it's missing VAOs and 21cm power at large scales
inputs_vavg = inputs.evolve_input_structs(FIX_VCB_AVG=True)
[ ]:
lcn = p21c.RectilinearLightconer.with_equal_cdist_slices(
    min_redshift=min(inputs.node_redshifts),
    max_redshift=max(inputs.node_redshifts),
    quantities=lightcone_quantities,
    resolution=inputs.simulation_options.cell_size,
)

_, _, _, lightcone_fid_vcb = p21c.run_lightcone(
    lightconer=lcn,
    initial_conditions=initial_conditions,
    global_quantities=lightcone_quantities,
    cache=p21c.OutputCache(output_dir),
    write=True,
)
---------------------------------------------------------------------------
KeyboardInterrupt                         Traceback (most recent call last)
Cell In[6], line 8
      1 lcn = p21c.RectilinearLightconer.with_equal_cdist_slices(
      2     min_redshift=5.0,
      3     max_redshift=35.0,
      4     quantities=lightcone_quantities,
      5     resolution=inputs.simulation_options.cell_size,
      6 )
----> 8 _, _, _, lightcone_fid_vcb = p21c.run_lightcone(
      9     lightconer=lcn,
     10     initial_conditions=initial_conditions,
     11     global_quantities=lightcone_quantities,
     12     cache=p21c.OutputCache(output_dir),
     13     write=True,
     14 )

File ~/miniconda3/envs/21cmfast/lib/python3.13/site-packages/py21cmfast/drivers/lightcone.py:631, in run_lightcone(**kwargs)
    630 def run_lightcone(**kwargs):  # noqa: D103
--> 631     return exhaust(generate_lightcone(**kwargs))

File ~/miniconda3/envs/21cmfast/lib/python3.13/site-packages/py21cmfast/drivers/__init__.py:23, in exhaust(generator)
     21 def exhaust(generator: Generator):
     22     """Exhaust a generator without keeping more than one return value in memory."""
---> 23     return deque(generator, maxlen=1)[0]

File ~/miniconda3/envs/21cmfast/lib/python3.13/site-packages/py21cmfast/drivers/_param_config.py:492, in high_level_func.__call__(self, **kwargs)
    488     kwargs["inputs"] = inputs
    490 self.check_consistency(kwargs, outputs)
--> 492 yield from self._func(**kwargs)

File ~/miniconda3/envs/21cmfast/lib/python3.13/site-packages/py21cmfast/drivers/lightcone.py:613, in generate_lightcone(lightconer, inputs, global_quantities, initial_conditions, cleanup, write, cache, regenerate, always_purge, lightcone_filename)
    597 iokw = {"cache": cache, "regenerate": regenerate}
    599 (
    600     initial_conditions,
    601     perturbed_fields,
   (...)    610     **iokw,
    611 )
--> 613 yield from _run_lightcone_from_perturbed_fields(
    614     initial_conditions=initial_conditions,
    615     perturbed_fields=perturbed_fields,
    616     lightconer=lightconer,
    617     inputs=inputs,
    618     regenerate=regenerate,
    619     pt_halos=pt_halos,
    620     photon_nonconservation_data=photon_nonconservation_data,
    621     global_quantities=global_quantities,
    622     cache=cache,
    623     write=write,
    624     cleanup=cleanup,
    625     always_purge=always_purge,
    626     lightcone_filename=lightcone_filename,
    627 )

File ~/miniconda3/envs/21cmfast/lib/python3.13/site-packages/py21cmfast/drivers/lightcone.py:449, in _run_lightcone_from_perturbed_fields(initial_conditions, perturbed_fields, lightconer, inputs, photon_nonconservation_data, pt_halos, regenerate, global_quantities, cache, cleanup, write, always_purge, lightcone_filename)
    446 if lightcone_filename and not Path(lightcone_filename).exists():
    447     lightcone.save(lightcone_filename)
--> 449 for iz, coeval in enumerate(
    450     _redshift_loop_generator(
    451         inputs=inputs,
    452         initial_conditions=initial_conditions,
    453         all_redshifts=scrollz,
    454         perturbed_field=perturbed_fields,
    455         pt_halos=pt_halos,
    456         write=write,
    457         cleanup=cleanup,
    458         always_purge=always_purge,
    459         photon_nonconservation_data=photon_nonconservation_data,
    460         start_idx=lightcone._last_completed_node + 1,
    461         init_coeval=prev_coeval,
    462         iokw=iokw,
    463     )
    464 ):
    465     # Save mean/global quantities
    466     for quantity in global_quantities:
    467         if quantity == "log10_mturn_acg":

File ~/miniconda3/envs/21cmfast/lib/python3.13/site-packages/py21cmfast/drivers/coeval.py:587, in _redshift_loop_generator(inputs, initial_conditions, all_redshifts, perturbed_field, pt_halos, write, iokw, cleanup, always_purge, photon_nonconservation_data, start_idx, init_coeval)
    576         xrs = None
    578     this_spin_temp = sf.compute_spin_temperature(
    579         previous_spin_temp=getattr(prev_coeval, "ts_box", None),
    580         perturbed_field=this_perturbed_field,
   (...)    584         cleanup=(cleanup and z == all_redshifts[-1]),
    585     )
--> 587 this_ionized_box = sf.compute_ionization_field(
    588     previous_ionized_box=getattr(prev_coeval, "ionized_box", None),
    589     perturbed_field=this_perturbed_field,
    590     # perturb field *not* interpolated here.
    591     previous_perturbed_field=getattr(prev_coeval, "perturbed_field", None),
    592     halobox=this_halobox,
    593     spin_temp=this_spin_temp,
    594     write=write.ionized_box,
    595     **kw,
    596 )
    598 if prev_coeval is not None:
    599     with contextlib.suppress(OSError):

File ~/miniconda3/envs/21cmfast/lib/python3.13/site-packages/py21cmfast/drivers/_param_config.py:465, in single_field_func.__call__(self, **kwargs)
    463     self._broadcast_inputs(inputs)
    464     self._make_wisdoms(inputs)
--> 465     out = self._func(**kwargs)
    466     self._handle_write_to_cache(cache, write, out)
    468 return out

File ~/miniconda3/envs/21cmfast/lib/python3.13/site-packages/py21cmfast/drivers/single_field.py:671, in compute_ionization_field(perturbed_field, initial_conditions, inputs, previous_perturbed_field, previous_ionized_box, spin_temp, halobox)
    668     raise ValueError("No spin temperature box given but USE_TS_FLUCT=True")
    670 # Run the C Code
--> 671 return box.compute(
    672     perturbed_field=perturbed_field,
    673     prev_perturbed_field=previous_perturbed_field,
    674     prev_ionize_box=previous_ionized_box,
    675     spin_temp=spin_temp,
    676     halobox=halobox,
    677     ics=initial_conditions,
    678 )

File ~/miniconda3/envs/21cmfast/lib/python3.13/site-packages/py21cmfast/wrapper/outputs.py:1335, in IonizedBox.compute(self, perturbed_field, prev_perturbed_field, prev_ionize_box, spin_temp, halobox, ics, allow_already_computed)
   1323 def compute(
   1324     self,
   1325     *,
   (...)   1332     allow_already_computed: bool = False,
   1333 ):
   1334     """Compute the function."""
-> 1335     return self._compute(
   1336         allow_already_computed,
   1337         self.redshift,
   1338         prev_perturbed_field.redshift,
   1339         perturbed_field,
   1340         prev_perturbed_field,
   1341         prev_ionize_box,
   1342         spin_temp,
   1343         halobox,
   1344         ics,
   1345     )

File ~/miniconda3/envs/21cmfast/lib/python3.13/site-packages/py21cmfast/wrapper/outputs.py:471, in OutputStruct._compute(self, allow_already_computed, *args)
    469 # Perform the C computation
    470 try:
--> 471     exitcode = self._c_compute_function(*inputs, self.cstruct)
    472 except TypeError as e:
    473     logger.error(f"Arguments to {self._c_compute_function.__name__}: {inputs}")

KeyboardInterrupt:
[ ]:
fig, axs = plt.subplots(
    len(lightcone_quantities), 1, figsize=(20, 10)
)
for ii, lightcone_quantity in enumerate(lightcone_quantities):
    axs[ii].imshow(
        lightcone_fid_vcb.lightcones[lightcone_quantity][1],
        vmin=vmins[ii],
        vmax=vmaxs[ii],
        cmap=cmaps[ii],
    )
    axs[ii].text(
        1,
        0.05,
        lightcone_quantity,
        horizontalalignment="right",
        verticalalignment="bottom",
        transform=axs[ii].transAxes,
        color="red",
        backgroundcolor="white",
        fontsize=15,
    )
    axs[ii].xaxis.set_tick_params(labelsize=10)
    axs[ii].yaxis.set_tick_params(labelsize=0)
plt.tight_layout()
fig.subplots_adjust(hspace=0.01)
[ ]:
# also run one without velocities and with fixed vcb=vavg (for comparison)
lightcone_fid_novcb = p21c.run_lightcone(
    lightconer=lcn,
    inputs=inputs_no_vcb,
    initial_conditions=initial_conditions,
    global_quantities=lightcone_quantities,
    cache=p21c.OutputCache(output_dir),
    write=True,
)

lightcone_fid_vcbavg = p21c.run_lightcone(
    lightconer=lcn,
    inputs=inputs_vavg,
    initial_conditions=initial_conditions,
    global_quantities=lightcone_quantities,
    cache=p21c.OutputCache(output_dir),
    write=True,
)
[ ]:
# plus run one with only atomic-cooling galaxies but same otherwise
inputs_acg = inputs.evolve_input_structs(USE_MINI_HALOS=False)
lightcone_fid_acg = p21c.run_lightcone(
    lightconer=lcn,
    inputs=inputs_acg,
    initial_conditions=initial_conditions,
    global_quantities=lightcone_quantities,
    cache=p21c.OutputCache(output_dir),
    write=True,
)
[ ]:
# compare vcb and novcb

fig, axs = plt.subplots(2, 1, figsize=(20, 6))

axs[0].imshow(
    lightcone_fid_vcb.brightness_temp[1], vmin=vmins[0], vmax=vmaxs[0], cmap=cmaps[0]
)
axs[1].imshow(
    lightcone_fid_novcb.brightness_temp[1], vmin=vmins[0], vmax=vmaxs[0], cmap=cmaps[0]
)
axs[0].text(
    1,
    0.05,
    "vcb",
    horizontalalignment="right",
    verticalalignment="bottom",
    transform=axs[0].transAxes,
    color="red",
    backgroundcolor="white",
    fontsize=15,
)
axs[1].text(
    1,
    0.05,
    "novcb",
    horizontalalignment="right",
    verticalalignment="bottom",
    transform=axs[1].transAxes,
    color="red",
    backgroundcolor="white",
    fontsize=15,
)
# axs[0].xaxis.set_tick_params(labelsize=10)
# axs[1].yaxis.set_tick_params(labelsize=0)
plt.tight_layout()
fig.subplots_adjust(hspace=0.01)
[ ]:
# plot tau

tau_vcb = tau_novcb = tau_NOMINI = np.array([])
for il, lightcone in enumerate(
    [lightcone_fid_vcb, lightcone_fid_novcb, lightcone_fid_acg]
):
    z_e = np.array([])
    tau_e = np.array([])
    for i in range(len(lightcone.node_redshifts) - 1):
        tauz = p21c.compute_tau(
            redshifts=lightcone.node_redshifts[-1 : -2 - i : -1],
            global_xHI=lightcone.global_xHI[-1 : -2 - i : -1],
        )
        tau_e = np.append(tau_e, tauz)
        z_e = np.append(z_e, lightcone.node_redshifts[-2 - i])

    # add lower zs where we manually set xH=1
    zlow = np.linspace(lightcone.node_redshifts[-1] - 0.1, 0.1, 14)
    for zl in zlow:
        tauz = p21c.compute_tau(
            redshifts=np.array([zl]), global_xHI=np.array([lightcone.global_xHI[-1]])
        )
        tau_e = np.append([tauz], tau_e)
        z_e = np.append([zl], z_e)

    if il == 0:
        tau_vcb = tau_e
    elif il == 1:
        tau_novcb = tau_e
    else:
        tau_NOMINI = tau_e


linestyles = ["-", "-.", ":"]
colors = ["black", "gray", "#377eb8"]
lws = [3, 1, 2]

fig, axs = plt.subplots(1, 1, sharex=True, figsize=(8, 4))

kk = 0
axs.plot(
    z_e, tau_vcb, label="vcb", color=colors[kk], linestyle=linestyles[kk], lw=lws[kk]
)
kk = 1
axs.plot(
    z_e,
    tau_novcb,
    label="no vcb",
    color=colors[kk],
    linestyle=linestyles[kk],
    lw=lws[kk],
)
kk = 2
axs.plot(
    z_e,
    tau_NOMINI,
    label="no MINI",
    color=colors[kk],
    linestyle=linestyles[kk],
    lw=lws[kk],
)

axs.set_ylim(0.0, 0.1)
axs.set_xlabel("redshift", fontsize=15)
axs.xaxis.set_tick_params(labelsize=15)

axs.set_xlim(0.0, 20.0)
axs.set_ylabel("$\\tau$", fontsize=15)
axs.yaxis.set_tick_params(labelsize=15)

plt.tight_layout()
fig.subplots_adjust(hspace=0.0, wspace=0.0)

tauPmin = 0.0561 - 0.0071
tauPmax = 0.0561 + 0.0071
axs.axhspan(tauPmin, tauPmax, alpha=0.34, color="black")
axs.grid()

# Planck2020: tau=0.0561±0.0071
[ ]:
# check that the tau z=15-30 is below 0.02 as Planck requires
tau_vcb[-1] - tau_vcb[55]
[ ]:
linestyles = ["-", "-.", ":"]
colors = ["black", "gray", "#377eb8"]
lws = [3, 1, 2]
labels = ["vcb", "no vcb", "no MINI"]

fig, axs = plt.subplots(1, 1, sharex=True, figsize=(8, 4))

for kk, lightcone in enumerate(
    [lightcone_fid_vcb, lightcone_fid_novcb, lightcone_fid_acg]
):
    axs.plot(
        lightcone.node_redshifts,
        lightcone.global_xHI,
        label=labels[kk],
        color=colors[kk],
        linestyle=linestyles[kk],
        lw=lws[kk],
    )

axs.set_ylim(0.0, 1.0)
axs.set_xlabel("redshift", fontsize=15)
axs.xaxis.set_tick_params(labelsize=15)

axs.set_xlim(5.0, 20.0)
axs.set_ylabel("$x_{HI}$", fontsize=15)
axs.yaxis.set_tick_params(labelsize=15)

plt.tight_layout()
fig.subplots_adjust(hspace=0.0, wspace=0.0)

axs.grid()
[ ]:
runcache = p21c.RunCache.from_inputs(inputs)
[ ]:
# choose a redshift to print coeval slices and see if there are VAOs. Usually best then T21~T21min/2
zz = zlist21[40]
[ ]:
# We plot a coeval box, but we compare the vcb case against the vcb=vavg, since the no velocity (vcb=0) case has a background evolution that is too different.
coeval_fid_vcb = runcache.get_coeval_at_z(inputs.node_redshifts)
p21c.run_coeval(
    redshift=zz,
    init_box=initial_conditions,
    flag_options=flag_options_fid,
    astro_params=astro_params_vcb,
    random_seed=random_seed,
    direc=output_dir,
    write=True,  # , regenerate=True
)

coeval_fid_vcbavg = p21c.run_coeval(
    redshift=zz,
    init_box=initial_conditions,
    flag_options=flag_options_fid_vavg,
    astro_params=astro_params_vcb,
    random_seed=random_seed,
    direc=output_dir,
    write=True,  # , regenerate=True
)
[ ]:
[ ]:
T21slice_vcb = coeval_fid_vcb.brightness_temp
T21avg_vcb = np.mean(T21slice_vcb)
dT21slice_vcb = T21slice_vcb - T21avg_vcb

T21slice_novcb = coeval_fid_vcbavg.brightness_temp
T21avg_novcb = np.mean(T21slice_novcb)
dT21slice_novcb = T21slice_novcb - T21avg_novcb


sigma21 = np.sqrt(np.var(dT21slice_vcb))

T21maxplot = 3.0 * sigma21
T21minplot = -2.0 * sigma21


origin = "lower"
extend = "both"

origin = None
extend = "neither"

xx = np.linspace(0, BOX_LEN, HII_DIM, endpoint=False)
yy = xx


indexv = 0

fig, ax = plt.subplots(
    2,
    2,
    constrained_layout=True,
    figsize=(10, 8),
    sharex="col",
    sharey="row",
    gridspec_kw={"hspace": 0, "wspace": 0},
)

cs0 = ax[0, 0].contourf(
    xx,
    yy,
    dT21slice_novcb[indexv],
    extend=extend,
    origin=origin,
    vmin=T21minplot,
    vmax=T21maxplot,
    cmap="bwr",
)
fig.colorbar(cs0, ax=ax[0, 0], shrink=0.9, location="left")
cs1 = ax[0, 1].contourf(
    xx,
    yy,
    dT21slice_vcb[indexv],
    extend=extend,
    origin=origin,
    vmin=T21minplot,
    vmax=T21maxplot,
    cmap="bwr",
)
fig.colorbar(cs1, ax=ax[0, 1], shrink=0.9)


deltaslice = initial_conditions.lowres_density
deltaavg = np.mean(deltaslice)
ddeltaslice = deltaslice - deltaavg

vcbslice = initial_conditions.lowres_vcb
vcbavg = np.mean(vcbslice)
dvcbslice = vcbslice


csd = ax[1, 0].contourf(xx, yy, ddeltaslice[indexv])
fig.colorbar(csd, ax=ax[1, 0], shrink=0.9, location="left")
csv = ax[1, 1].contourf(xx, yy, dvcbslice[indexv])
fig.colorbar(csv, ax=ax[1, 1], shrink=0.9, extend=extend)
plt.show()

plt.tight_layout()
[ ]:
global_quantities = (
    "brightness_temp",
    "spin_temperature",
    "neutral_fraction",
    "cumulative_recombinations",
    "z_reion",
    "ionisation_rate_G12",
    "J_21_LW",
    "density",
)
# choose some to plot...
plot_quantities = (
    "brightness_temp",
    "spin_temperature",
    "neutral_fraction",
    "cumulative_recombinations",
    "ionisation_rate_G12",
    "J_21_LW",
)
ymins = [-120, 1e1, 0, 0, 0, 0]
ymaxs = [30, 1e3, 1, 1, 1, 5]
linestyles = ["-", "-", ":", "-.", "-.", ":"]
colors = ["gray", "black", "#e41a1c", "#377eb8", "#e41a1c", "#377eb8"]
lws = [2, 2, 2, 2]

textss = ["vcb", "MCGs"]
factorss = [
    [0, 1],
] * len(textss)
labelss = [
    ["NO", "reference"],
] * len(textss)


fig, axss = plt.subplots(
    len(plot_quantities),
    len(labelss),
    sharex=True,
    figsize=(4 * len(labelss), 2 * len(plot_quantities)),
)

for pp, texts in enumerate(textss):
    labels = labelss[pp]
    factors = factorss[pp]
    axs = axss[:, pp]
    for kk, label in enumerate(labels):
        factor = factors[kk]

        if kk == 0:
            lightcone = lightcone_fid_acg if pp == 0 else lightcone_fid_novcb
        else:
            lightcone = lightcone_fid_vcb

        freqs = 1420.4 / (np.array(lightcone.node_redshifts) + 1.0)
        for jj, global_quantity in enumerate(plot_quantities):
            axs[jj].plot(
                freqs,
                getattr(
                    lightcone, "global_{}".format(global_quantity.replace("_box", ""))
                ),
                color=colors[kk],
                linestyle=linestyles[kk],
                label=labels[kk],
                lw=lws[kk],
            )

    axs[0].text(
        0.01,
        0.99,
        texts,
        horizontalalignment="right",
        verticalalignment="bottom",
        transform=axs[0].transAxes,
        fontsize=15,
    )
    for jj, global_quantity in enumerate(plot_quantities):
        axs[jj].set_ylim(ymins[jj], ymaxs[jj])
    axs[-1].set_xlabel("Frequency/MHz", fontsize=15)
    axs[-1].xaxis.set_tick_params(labelsize=15)

    axs[0].set_xlim(1420.4 / (35 + 1.0), 1420.4 / (5.5 + 1.0))
    zlabels = np.array([6, 7, 8, 10, 13, 18, 25, 35])
    ax2 = axs[0].twiny()
    ax2.set_xlim(axs[0].get_xlim())
    ax2.set_xticks(1420.4 / (zlabels + 1.0))
    ax2.set_xticklabels(zlabels.astype(str))
    ax2.set_xlabel("redshift", fontsize=15)
    ax2.xaxis.set_tick_params(labelsize=15)
    ax2.grid(False)

    if pp == 0:
        axs[0].legend(
            loc="lower right", ncol=2, fontsize=13, fancybox=True, frameon=True
        )
        for jj, global_quantity in enumerate(plot_quantities):
            axs[jj].set_ylabel(
                "global_{}".format(global_quantity.replace("_box", "")), fontsize=15
            )
            axs[jj].yaxis.set_tick_params(labelsize=15)
    else:
        for jj, global_quantity in enumerate(plot_quantities):
            axs[jj].set_ylabel(
                "global_{}".format(global_quantity.replace("_box", "")), fontsize=0
            )
            axs[jj].yaxis.set_tick_params(labelsize=0)

plt.tight_layout()
fig.subplots_adjust(hspace=0.0, wspace=0.0)
Varying parameters
let’s vary the parameters that describe mini-halos and see the impact to the global signal. Warning: It may take a while to run all these boxes!
We keep other parameters fixed and vary one of following by a factor of 1/3 and 3:
F_STAR7_MINI
F_ESC7_MINI
L_X_MINI
A_LW
We also have a NOmini model where mini-halos are not included
[ ]:
# defining those color, linstyle, blabla
linestyles = ["-", "-", ":", "-.", "-.", ":"]
colors = ["gray", "black", "#e41a1c", "#377eb8", "#e41a1c", "#377eb8"]
lws = [1, 3, 2, 2, 2, 2]

textss = [
    "varying " + r"$f_{*,7}^{\rm mol}$",
    "varying " + r"$f_{\rm esc}^{\rm mol}$",
    "varying " + r"$L_{\rm x}^{\rm mol}$",
    "varying " + r"$A_{\rm LW}$",
]
factorss = [
    [0, 1, 0.33, 3.0],
] * len(textss)
labelss = [
    ["No Velocity", "Fiducial", "/3", "x3"],
] * len(textss)
[ ]:
global_quantities = (
    "brightness_temp",
    "spin_temperature",
    "neutral_fraction",
    "cumulative_recombinations",
    "z_reion",
    "ionisation_rate_G12",
    "J_21_LW",
    "density",
)
# choose some to plot...
plot_quantities = (
    "brightness_temp",
    "spin_temperature",
    "neutral_fraction",
    "cumulative_recombinations",
    "ionisation_rate_G12",
    "J_21_LW",
)
ymins = [-120, 1e1, 0, 0, 0, 0]
ymaxs = [30, 1e3, 1, 1, 1, 10]

fig, axss = plt.subplots(
    len(plot_quantities),
    len(labelss),
    sharex=True,
    figsize=(4 * len(labelss), 2 * len(global_quantities)),
)

for pp, texts in enumerate(textss):
    labels = labelss[pp]
    factors = factorss[pp]
    axs = axss[:, pp]
    for kk, label in enumerate(labels):
        flag_options = flag_options_fid.copy()
        astro_params = astro_params_vcb.copy()
        factor = factors[kk]
        if label == "No Velocity":
            lightcone = lightcone_fid_novcb
        elif label == "Fiducial":
            lightcone = lightcone_fid_vcb
        else:
            if pp == 0:
                astro_params.update(
                    {
                        "F_STAR7_MINI": astro_params_vcb["F_STAR7_MINI"]
                        + np.log10(factor)
                    }
                )
            elif pp == 1:
                astro_params.update(
                    {"F_ESC7_MINI": astro_params_vcb["F_ESC7_MINI"] + np.log10(factor)}
                )
            elif pp == 2:
                astro_params.update(
                    {"L_X_MINI": astro_params_vcb["L_X_MINI"] + np.log10(factor)}
                )
            elif pp == 3:
                astro_params.update({"A_LW": astro_params_vcb["A_LW"] * factor})
            else:
                pass

            lightcone = p21c.run_lightcone(
                redshift=ZMIN,
                init_box=initial_conditions,
                flag_options=flag_options_fid,
                astro_params=astro_params,
                global_quantities=global_quantities,
                random_seed=random_seed,
                direc=output_dir,
            )

        freqs = 1420.4 / (np.array(lightcone.node_redshifts) + 1.0)
        for jj, global_quantity in enumerate(plot_quantities):
            axs[jj].plot(
                freqs,
                getattr(
                    lightcone, "global_{}".format(global_quantity.replace("_box", ""))
                ),
                color=colors[kk],
                linestyle=linestyles[kk],
                label=labels[kk],
                lw=lws[kk],
            )

    axs[0].text(
        0.01,
        0.99,
        texts,
        horizontalalignment="left",
        verticalalignment="top",
        transform=axs[0].transAxes,
        fontsize=15,
    )
    for jj, global_quantity in enumerate(plot_quantities):
        axs[jj].set_ylim(ymins[jj], ymaxs[jj])
    axs[-1].set_xlabel("Frequency/MHz", fontsize=15)
    axs[-1].xaxis.set_tick_params(labelsize=15)

    axs[0].set_xlim(1420.4 / (35 + 1.0), 1420.4 / (5.5 + 1.0))
    zlabels = np.array([6, 7, 8, 10, 13, 18, 25, 35])
    ax2 = axs[0].twiny()
    ax2.set_xlim(axs[0].get_xlim())
    ax2.set_xticks(1420.4 / (zlabels + 1.0))
    ax2.set_xticklabels(zlabels.astype(str))
    ax2.set_xlabel("redshift", fontsize=15)
    ax2.xaxis.set_tick_params(labelsize=15)
    ax2.grid(False)

    if pp == 0:
        axs[0].legend(
            loc="lower right", ncol=2, fontsize=13, fancybox=True, frameon=True
        )
        for jj, global_quantity in enumerate(plot_quantities):
            axs[jj].set_ylabel(
                "global_{}".format(global_quantity.replace("_box", "")), fontsize=15
            )
            axs[jj].yaxis.set_tick_params(labelsize=15)
    else:
        for jj, global_quantity in enumerate(plot_quantities):
            axs[jj].set_ylabel(
                "global_{}".format(global_quantity.replace("_box", "")), fontsize=0
            )
            axs[jj].yaxis.set_tick_params(labelsize=0)

plt.tight_layout()
fig.subplots_adjust(hspace=0.0, wspace=0.0)
[ ]:
[ ]:
# define functions to calculate PS, following py21cmmc
from powerbox.tools import get_power


def compute_power(
    box,
    length,
    n_psbins,
    log_bins=True,
    ignore_kperp_zero=True,
    ignore_kpar_zero=False,
    ignore_k_zero=False,
):
    # Determine the weighting function required from ignoring k's.
    k_weights = np.ones(box.shape, dtype=int)
    n0 = k_weights.shape[0]
    n1 = k_weights.shape[-1]

    if ignore_kperp_zero:
        k_weights[n0 // 2, n0 // 2, :] = 0
    if ignore_kpar_zero:
        k_weights[:, :, n1 // 2] = 0
    if ignore_k_zero:
        k_weights[n0 // 2, n0 // 2, n1 // 2] = 0

    res = get_power(
        box,
        boxlength=length,
        bins=n_psbins,
        bin_ave=False,
        get_variance=False,
        log_bins=log_bins,
        k_weights=k_weights,
    )

    res = list(res)
    k = res[1]
    if log_bins:
        k = np.exp((np.log(k[1:]) + np.log(k[:-1])) / 2)
    else:
        k = (k[1:] + k[:-1]) / 2

    res[1] = k
    return res


def powerspectra(
    brightness_temp, n_psbins=50, nchunks=10, min_k=0.1, max_k=1.0, logk=True
):
    data = []
    chunk_indices = list(
        range(
            0,
            brightness_temp.n_slices,
            round(brightness_temp.n_slices / nchunks),
        )
    )

    if len(chunk_indices) > nchunks:
        chunk_indices = chunk_indices[:-1]
    chunk_indices.append(brightness_temp.n_slices)

    for i in range(nchunks):
        start = chunk_indices[i]
        end = chunk_indices[i + 1]
        chunklen = (end - start) * brightness_temp.cell_size

        power, k = compute_power(
            brightness_temp.brightness_temp[:, :, start:end],
            (BOX_LEN, BOX_LEN, chunklen),
            n_psbins,
            log_bins=logk,
        )
        data.append({"k": k, "delta": power * k**3 / (2 * np.pi**2)})
    return data
[ ]:
# do 5 chunks but only plot 1 - 4, the 0th has no power for minihalo models where xH=0
nchunks = 4
k_fundamental = 2 * np.pi / BOX_LEN
k_max = k_fundamental * HII_DIM
Nk = np.floor(HII_DIM / 1).astype(int)

fig, axss = plt.subplots(
    nchunks,
    len(labelss),
    sharex=True,
    sharey=True,
    figsize=(4 * len(labelss), 3 * (nchunks)),
    subplot_kw={"xscale": "log", "yscale": "log"},
)

for pp, texts in enumerate(textss):
    labels = labelss[pp]
    factors = factorss[pp]
    axs = axss[:, pp]
    for kk, label in enumerate(labels):
        flag_options = flag_options_fid.copy()
        astro_params = astro_params_vcb.copy()
        factor = factors[kk]
        if label == "No Velocity":
            lightcone = lightcone_fid_novcb
        elif label == "Fiducial":
            lightcone = lightcone_fid_vcb
        else:
            if pp == 0:
                astro_params.update(
                    {
                        "F_STAR7_MINI": astro_params_vcb["F_STAR7_MINI"]
                        + np.log10(factor)
                    }
                )
            elif pp == 1:
                astro_params.update(
                    {"F_ESC7_MINI": astro_params_vcb["F_ESC7_MINI"] + np.log10(factor)}
                )
            elif pp == 2:
                astro_params.update(
                    {"L_X_MINI": astro_params_vcb["L_X_MINI"] + np.log10(factor)}
                )
            elif pp == 3:
                astro_params.update(
                    {"A_LW": astro_params_vcb["A_LW"] + np.log10(factor)}
                )
            else:
                pass

            lightcone = p21c.run_lightcone(
                redshift=ZMIN,
                init_box=initial_conditions,
                flag_options=flag_options_fid,
                astro_params=astro_params,
                global_quantities=global_quantities,
                random_seed=random_seed,
                direc=output_dir,
            )

        PS = powerspectra(lightcone, min_k=k_fundamental, max_k=k_max)

        for ii in range(nchunks):
            axs[ii].plot(
                PS[ii + 1]["k"],
                PS[ii + 1]["delta"],
                color=colors[kk],
                linestyle=linestyles[kk],
                label=labels[kk],
                lw=lws[kk],
            )

            if pp == len(textss) - 1 and kk == 0:
                axs[ii].text(
                    0.99,
                    0.01,
                    "Chunk-%02d" % (ii + 1),
                    horizontalalignment="right",
                    verticalalignment="bottom",
                    transform=axs[ii].transAxes,
                    fontsize=15,
                )

    axs[0].text(
        0.01,
        0.99,
        texts,
        horizontalalignment="left",
        verticalalignment="top",
        transform=axs[0].transAxes,
        fontsize=15,
    )

    axs[-1].set_xlabel("$k$ [Mpc$^{-3}$]", fontsize=15)
    axs[-1].xaxis.set_tick_params(labelsize=15)

    if pp == 0:
        for ii in range(nchunks):
            axs[ii].set_ylim(2e-1, 2e2)
            axs[ii].set_ylabel("$k^3 P$", fontsize=15)
            axs[ii].yaxis.set_tick_params(labelsize=15)
    else:
        for ii in range(nchunks - 1):
            axs[ii].set_ylim(2e-1, 2e2)
            axs[ii].set_ylabel("$k^3 P$", fontsize=0)
            axs[ii].yaxis.set_tick_params(labelsize=0)

axss[0, 0].legend(loc="lower left", ncol=2, fontsize=13, fancybox=True, frameon=True)
plt.tight_layout()
fig.subplots_adjust(hspace=0.0, wspace=0.0)
Note that I’ve run these simulations in parallel before this tutorial. With these setup, each took ~6h to finish. Here, running means read the cached outputs.
global properties – optical depth
[ ]:
# defining those color, linstyle, blabla
linestyles = ["-", "-", ":", "-.", "-.", ":"]
colors = ["gray", "black", "#e41a1c", "#377eb8", "#e41a1c", "#377eb8"]
lws = [1, 3, 2, 2, 2, 2]

textss_tau = [
    "varying " + r"$f_{*,7}^{\rm mol}$",
    "varying " + r"$f_{\rm esc}^{\rm mol}$",
    "varying " + r"$A_{\rm LW}$",
]

factorss_tau = [
    [0, 1, 0.33, 3.0],
] * len(textss_tau)
labelss_tau = [
    ["No Velocity", "Fiducial", "/3", "x3"],
] * len(textss_tau)
[ ]:
plot_quantities = ["tau_e"]
ymins = [0]
ymaxs = [0.2]


fig, axss_tau = plt.subplots(
    len(plot_quantities),
    len(labelss_tau),
    sharex=True,
    figsize=(4 * len(labelss_tau), 3 * len(plot_quantities)),
)


for pp, texts in enumerate(textss_tau):
    labels = labelss_tau[pp]
    factors = factorss_tau[pp]
    axs = axss_tau[pp]
    for kk, label in enumerate(labels):
        flag_options = flag_options_fid.copy()
        astro_params = astro_params_vcb.copy()
        factor = factors[kk]
        if label == "No Velocity":
            lightcone = lightcone_fid_novcb
        elif label == "Fiducial":
            lightcone = lightcone_fid_vcb
        else:
            if pp == 0:
                astro_params.update(
                    {
                        "F_STAR7_MINI": astro_params_vcb["F_STAR7_MINI"]
                        + np.log10(factor)
                    }
                )
            elif pp == 1:
                astro_params.update(
                    {"F_ESC7_MINI": astro_params_vcb["F_ESC7_MINI"] + np.log10(factor)}
                )
            elif pp == 2:
                astro_params.update({"A_LW": astro_params_vcb["A_LW"] * factor})
            else:
                pass

            lightcone = p21c.run_lightcone(
                redshift=ZMIN,
                init_box=initial_conditions,
                flag_options=flag_options_fid,
                astro_params=astro_params,
                global_quantities=global_quantities,
                random_seed=random_seed,
                direc=output_dir,
            )

        z_e = np.array([])
        tau_e = np.array([])
        for i in range(len(lightcone.node_redshifts) - 1):
            tauz = p21c.compute_tau(
                redshifts=lightcone.node_redshifts[-1 : -2 - i : -1],
                global_xHI=lightcone.global_xHI[-1 : -2 - i : -1],
            )
            tau_e = np.append(tau_e, tauz)
            z_e = np.append(z_e, lightcone.node_redshifts[-2 - i])
            # print(i,lightcone.node_redshifts[i],tauz)

        # add lower zs where we manually set xH=1
        zlow = np.linspace(lightcone.node_redshifts[-1] - 0.1, 0.1, 14)
        for zl in zlow:
            tauz = p21c.compute_tau(
                redshifts=np.array([zl]),
                global_xHI=np.array([lightcone.global_xHI[-1]]),
            )
            tau_e = np.append([tauz], tau_e)
            z_e = np.append([zl], z_e)

        #        freqs = 1420.4 / (np.array(lightcone.node_redshifts) + 1.)
        for jj, global_quantity in enumerate(plot_quantities):
            axs.plot(
                z_e,
                tau_e,
                color=colors[kk],
                linestyle=linestyles[kk],
                label=labels[kk],
                lw=lws[kk],
            )

    axs.text(
        0.01,
        0.99,
        texts,
        horizontalalignment="left",
        verticalalignment="top",
        transform=axs.transAxes,
        fontsize=15,
    )
    axs.set_ylim(ymins[0], ymaxs[0])
    axs.set_xlabel("redshift", fontsize=15)
    axs.xaxis.set_tick_params(labelsize=15)

    axs.set_xlim(0.0, 20.0)

    if pp == 0:
        for ii in range(nchunks):
            axs.set_ylabel("$\\tau$", fontsize=15)
            axs.yaxis.set_tick_params(labelsize=15)
    else:
        for ii in range(nchunks - 1):
            axs.yaxis.set_tick_params(labelsize=0)

plt.tight_layout()
fig.subplots_adjust(hspace=0.0, wspace=0.0)
[ ]:
[ ]:
21-cm power spectra
[ ]:
# do 5 chunks but only plot 1 - 4, the 0th has no power for minihalo models where xH=0
nchunks = 4

fig, axss = plt.subplots(
    nchunks,
    len(labelss),
    sharex=True,
    sharey=True,
    figsize=(4 * len(labelss), 3 * (nchunks)),
    subplot_kw={"xscale": "log", "yscale": "log"},
)

for pp, texts in enumerate(textss):
    labels = labelss[pp]
    factors = factorss[pp]
    axs = axss[:, pp]
    for kk, label in enumerate(labels):
        factor = factors[kk]

        lightcone = lightcone_fid_vcbavg if kk == 0 else lightcone_fid_vcb

        PS = powerspectra(lightcone, min_k=k_fundamental, max_k=k_max)
        for ii in range(nchunks):
            axs[ii].plot(
                PS[ii + 1]["k"],
                PS[ii + 1]["delta"],
                color=colors[kk],
                linestyle=linestyles[kk],
                label=labels[kk],
                lw=lws[kk],
            )

            if pp == len(textss) - 1 and kk == 0:
                axs[ii].text(
                    0.99,
                    0.01,
                    "Chunk-%02d" % (ii + 1),
                    horizontalalignment="right",
                    verticalalignment="bottom",
                    transform=axs[ii].transAxes,
                    fontsize=15,
                )

    axs[0].text(
        0.01,
        0.99,
        texts,
        horizontalalignment="left",
        verticalalignment="top",
        transform=axs[0].transAxes,
        fontsize=15,
    )

    axs[-1].set_xlabel("$k$ [Mpc$^{-3}$]", fontsize=15)
    axs[-1].xaxis.set_tick_params(labelsize=15)

    if pp == 0:
        for ii in range(nchunks):
            axs[ii].set_ylim(2e-1, 2e2)
            axs[ii].set_ylabel("$k^3 P$", fontsize=15)
            axs[ii].yaxis.set_tick_params(labelsize=15)
    else:
        for ii in range(nchunks - 1):
            axs[ii].set_ylim(2e-1, 2e2)
            axs[ii].set_ylabel("$k^3 P$", fontsize=0)
            axs[ii].yaxis.set_tick_params(labelsize=0)

axss[0, 0].legend(loc="lower left", ncol=2, fontsize=13, fancybox=True, frameon=True)
plt.tight_layout()
fig.subplots_adjust(hspace=0.0, wspace=0.0)
[ ]:
nchunks = 5

textss = ["vcb", "vcb"]
factorss = [
    [0, 1],
] * len(textss)
labelss = [
    ["Regular", "Avg"],
] * len(textss)

k_fundamental = 2 * np.pi / BOX_LEN
k_max = k_fundamental * HII_DIM
Nk = np.floor(HII_DIM / 1).astype(int)

PSv = powerspectra(lightcone_fid_vcb, min_k=k_fundamental, max_k=k_max)
PSvavg = powerspectra(lightcone_fid_vcbavg, min_k=k_fundamental, max_k=k_max)
[ ]:
klist = PSv[0]["k"]
P21diff = [
    (PSv[i]["delta"] - PSvavg[i]["delta"]) / PSvavg[i]["delta"] for i in range(nchunks)
]

import matplotlib.pyplot as plt

fig, axss = plt.subplots(
    nchunks,
    1,
    sharex=True,
    sharey=True,
    figsize=(2 * len(labelss), 3 * (nchunks)),
    subplot_kw={"xscale": "linear", "yscale": "linear"},
)

for ii in range(nchunks):
    axss[ii].plot(klist, P21diff[ii])

plt.xscale("log")
axss[0].legend(loc="lower left", ncol=2, fontsize=13, fancybox=True, frameon=True)
plt.tight_layout()
fig.subplots_adjust(hspace=0.0, wspace=0.0)
[ ]: